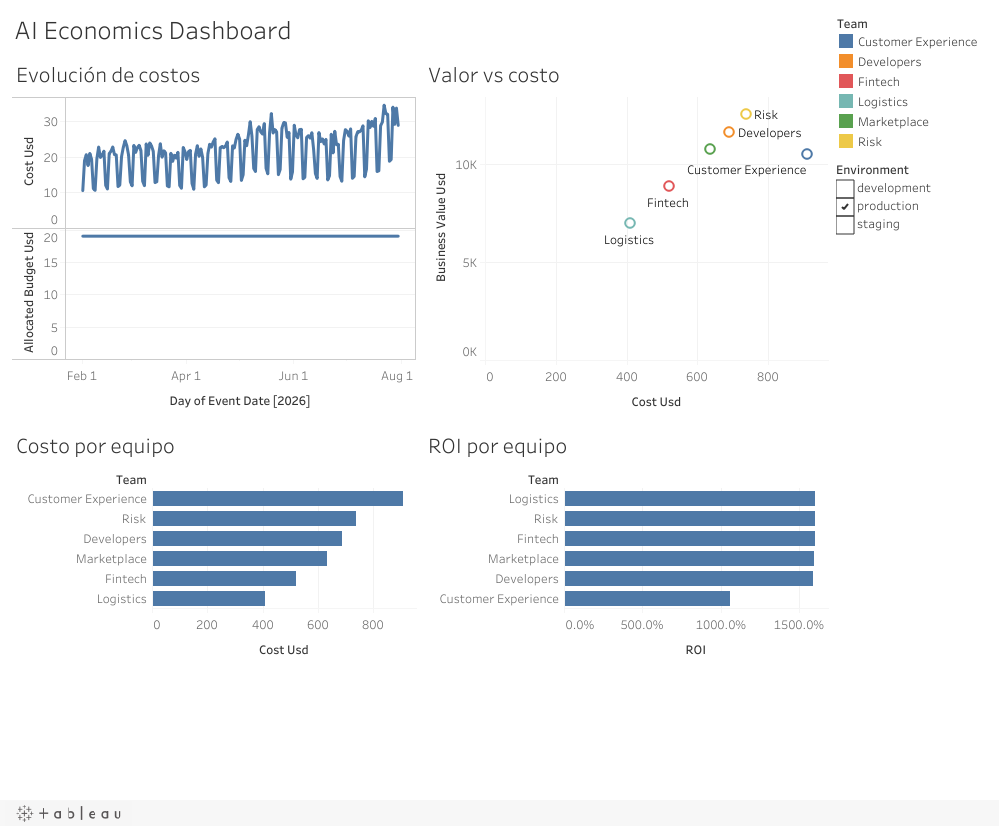
AI Economics — Cost & ROI Dashboard
Overview
A business intelligence and data engineering case study applying concepts from my Database course to the operational economics of enterprise AI infrastructure. The dashboard transforms daily LLM and model server operational logs into executive KPIs: spend velocity, budget burn rate, business value delivered, and return on investment (ROI).
Key Features
- Synthetic Realistic Dataset: Synthesized a 16,200-row daily AI usage dataset spanning 180 operational days, 6 engineering teams, 5 AI model families, and 3 deployment environments (prod, dev, staging).
- Relational Data Modeling: Designed SQL schemas capturing token counts, request frequencies, p95 latency, error rates, hourly GPU rates, and financial budget allocations.
- Interactive Tableau Dashboard: Built multi-level analytical views: Cost Evolution, Cost by Team, Business Value vs. Cost, and Team ROI rankings with cross-filtering.
- FinOps Decision Support: Identifies budget variances, runaway development workloads, and high-efficiency models that maximize business return per dollar spent.
Architecture & Implementation
A Python generation pipeline simulates realistic diurnal and weekly traffic spikes, latency anomalies, and billing rates. SQL scripts structure the tables into fact and dimension tables compatible with BigQuery. The curated views are ingested into Tableau Public with interactive filters and calculated ROI fields.
Results & Performance
The dashboard summarized 1,977,736 model requests and $3,897.86 in total compute costs. It successfully uncovered a 13.4% budget overrun in staging workloads and highlighted teams with over 14.73x estimated net return per unit of infrastructure cost.